!pip install ydata_profiling
!pip install catboost
!pip install --upgrade scikit-learn
!git clone https://github.com/hsma-programme/h6_4e_boosted_trees.git
%cd /content/h6_4e_boosted_trees/exercises_colab10 Exercise Solution: Regression with Trees (LOS Dataset)
If using colab, run this cell first. Otherwise, skip this cell.
10.1 Core
We’re going to work with a dataset to try to predict patient length of stay.
import pandas as pd
import matplotlib.pyplot as plt
%matplotlib inline
# import the relevant models from Sklearn, XGBoost, CatBoost and LightGBM
from sklearn.linear_model import LinearRegression
from sklearn.tree import DecisionTreeRegressor
from sklearn.ensemble import RandomForestRegressor
from ydata_profiling import ProfileReport
from sklearn.preprocessing import StandardScaler
from sklearn.model_selection import train_test_split
from xgboost import XGBRegressor
from lightgbm import LGBMRegressor
from catboost import CatBoostRegressor
from sklearn.ensemble import HistGradientBoostingRegressor
# import any other libraries you need
import numpy as np
from sklearn.metrics import mean_absolute_error, mean_absolute_percentage_error, \
r2_score, root_mean_squared_errorOpen the data dictionary in the los_dataset folder and take a look at what data is available.
Next, load in the dataframe containing the LOS data.
los_df = pd.read_csv("../datasets/los_dataset/LengthOfStay.csv", index_col="eid")View the dataframe.
los_df.head()| vdate | rcount | gender | dialysisrenalendstage | asthma | irondef | pneum | substancedependence | psychologicaldisordermajor | depress | ... | sodium | glucose | bloodureanitro | creatinine | bmi | pulse | respiration | secondarydiagnosisnonicd9 | facid | lengthofstay | |
|---|---|---|---|---|---|---|---|---|---|---|---|---|---|---|---|---|---|---|---|---|---|
| eid | |||||||||||||||||||||
| 1 | 8/29/2012 | 0 | F | 0 | 0 | 0 | 0 | 0 | 0 | 0 | ... | 140.361132 | 192.476918 | 12.0 | 1.390722 | 30.432418 | 96 | 6.5 | 4 | B | 3 |
| 2 | 5/26/2012 | 5+ | F | 0 | 0 | 0 | 0 | 0 | 0 | 0 | ... | 136.731692 | 94.078507 | 8.0 | 0.943164 | 28.460516 | 61 | 6.5 | 1 | A | 7 |
| 3 | 9/22/2012 | 1 | F | 0 | 0 | 0 | 0 | 0 | 0 | 0 | ... | 133.058514 | 130.530524 | 12.0 | 1.065750 | 28.843812 | 64 | 6.5 | 2 | B | 3 |
| 4 | 8/9/2012 | 0 | F | 0 | 0 | 0 | 0 | 0 | 0 | 0 | ... | 138.994023 | 163.377028 | 12.0 | 0.906862 | 27.959007 | 76 | 6.5 | 1 | A | 1 |
| 5 | 12/20/2012 | 0 | F | 0 | 0 | 0 | 1 | 0 | 1 | 0 | ... | 138.634836 | 94.886654 | 11.5 | 1.242854 | 30.258927 | 67 | 5.6 | 2 | E | 4 |
5 rows × 26 columns
ProfileReport(los_df)Consider what columns to remove.
HINT: Is there a column in the dataset that doesn’t really make much sense to predict from? If you’re not sure, use the full dataset for now and come back to this later.
NOTE: For now, we’re going to assume that all of the included measures will be available to us at the point we need to make a prediction - they’re not things that will be calculated later in the patient’s stay.
los_df = los_df.drop(columns="vdate")
los_df.head(1)| rcount | gender | dialysisrenalendstage | asthma | irondef | pneum | substancedependence | psychologicaldisordermajor | depress | psychother | ... | sodium | glucose | bloodureanitro | creatinine | bmi | pulse | respiration | secondarydiagnosisnonicd9 | facid | lengthofstay | |
|---|---|---|---|---|---|---|---|---|---|---|---|---|---|---|---|---|---|---|---|---|---|
| eid | |||||||||||||||||||||
| 1 | 0 | F | 0 | 0 | 0 | 0 | 0 | 0 | 0 | 0 | ... | 140.361132 | 192.476918 | 12.0 | 1.390722 | 30.432418 | 96 | 6.5 | 4 | B | 3 |
1 rows × 25 columns
Convert categories with only two options into a boolean value (e.g. for a gender column in which gender has only been provided as M or F, you could encode M as 0 and F as 1).
los_df.gender.unique()array(['F', 'M'], dtype=object)los_df['gender'].replace('M', 0, inplace=True)
los_df['gender'].replace('F', 1, inplace=True)
los_df.gender.unique()array([1, 0], dtype=int64)Convert columns with multiple options per category into multiple columns using one-hot encoding.
los_df.facid.unique()
# Bonus - astype('int') will convert the true/false values to 0/1
# not necessary - it will work regardless
one_hot = pd.get_dummies(los_df['facid']).astype('int')
los_df = los_df.drop('facid', axis=1)
los_df = los_df.join(one_hot)los_df.head()| rcount | gender | dialysisrenalendstage | asthma | irondef | pneum | substancedependence | psychologicaldisordermajor | depress | psychother | ... | bmi | pulse | respiration | secondarydiagnosisnonicd9 | lengthofstay | A | B | C | D | E | |
|---|---|---|---|---|---|---|---|---|---|---|---|---|---|---|---|---|---|---|---|---|---|
| eid | |||||||||||||||||||||
| 1 | 0 | 1 | 0 | 0 | 0 | 0 | 0 | 0 | 0 | 0 | ... | 30.432418 | 96 | 6.5 | 4 | 3 | 0 | 1 | 0 | 0 | 0 |
| 2 | 5+ | 1 | 0 | 0 | 0 | 0 | 0 | 0 | 0 | 0 | ... | 28.460516 | 61 | 6.5 | 1 | 7 | 1 | 0 | 0 | 0 | 0 |
| 3 | 1 | 1 | 0 | 0 | 0 | 0 | 0 | 0 | 0 | 0 | ... | 28.843812 | 64 | 6.5 | 2 | 3 | 0 | 1 | 0 | 0 | 0 |
| 4 | 0 | 1 | 0 | 0 | 0 | 0 | 0 | 0 | 0 | 0 | ... | 27.959007 | 76 | 6.5 | 1 | 1 | 1 | 0 | 0 | 0 | 0 |
| 5 | 0 | 1 | 0 | 0 | 0 | 1 | 0 | 1 | 0 | 0 | ... | 30.258927 | 67 | 5.6 | 2 | 4 | 0 | 0 | 0 | 0 | 1 |
5 rows × 29 columns
los_df.rcount.value_counts()
# Bonus - astype('int') will convert the true/false values to 0/1
# not necessary - it will work regardless
one_hot = pd.get_dummies(los_df['rcount'], prefix="rcount").astype('int')
los_df = los_df.drop('rcount', axis=1)
los_df = los_df.join(one_hot)
los_df.head()| gender | dialysisrenalendstage | asthma | irondef | pneum | substancedependence | psychologicaldisordermajor | depress | psychother | fibrosisandother | ... | B | C | D | E | rcount_0 | rcount_1 | rcount_2 | rcount_3 | rcount_4 | rcount_5+ | |
|---|---|---|---|---|---|---|---|---|---|---|---|---|---|---|---|---|---|---|---|---|---|
| eid | |||||||||||||||||||||
| 1 | 1 | 0 | 0 | 0 | 0 | 0 | 0 | 0 | 0 | 0 | ... | 1 | 0 | 0 | 0 | 1 | 0 | 0 | 0 | 0 | 0 |
| 2 | 1 | 0 | 0 | 0 | 0 | 0 | 0 | 0 | 0 | 0 | ... | 0 | 0 | 0 | 0 | 0 | 0 | 0 | 0 | 0 | 1 |
| 3 | 1 | 0 | 0 | 0 | 0 | 0 | 0 | 0 | 0 | 0 | ... | 1 | 0 | 0 | 0 | 0 | 1 | 0 | 0 | 0 | 0 |
| 4 | 1 | 0 | 0 | 0 | 0 | 0 | 0 | 0 | 0 | 0 | ... | 0 | 0 | 0 | 0 | 1 | 0 | 0 | 0 | 0 | 0 |
| 5 | 1 | 0 | 0 | 0 | 1 | 0 | 1 | 0 | 0 | 0 | ... | 0 | 0 | 0 | 1 | 1 | 0 | 0 | 0 | 0 | 0 |
5 rows × 34 columns
Train a decision tree model to predict length of stay based on the variables in this dataset.
X = los_df.drop(columns='lengthofstay')
y = los_df['lengthofstay']
X_train, X_test, y_train, y_test = train_test_split(
X, y,
test_size = 0.25,
random_state=42
)
regr_dt = DecisionTreeRegressor(random_state=42)
# Train the model using the training sets
regr_dt.fit(X_train, y_train)
# Make predictions using the testing set
y_pred_train = regr_dt.predict(X_train)
y_pred_test = regr_dt.predict(X_test)y_pred_testarray([3., 1., 3., ..., 8., 2., 5.])Assess the performance of this model.
print("TRAINING DATA")
print(f"Mean absolute error: {mean_absolute_error(y_train, y_pred_train):.2f}")
print(f"Mean absolute percentage error: {mean_absolute_percentage_error(y_train, y_pred_train):.2%}" )
print("Root Mean squared error: %.2f" % root_mean_squared_error(y_train, y_pred_train))
# The coefficient of determination: 1 is perfect prediction
print("Coefficient of determination: %.2f" % r2_score(y_train, y_pred_train))TRAINING DATA
Mean absolute error: 0.00
Mean absolute percentage error: 0.00%
Root Mean squared error: 0.00
Coefficient of determination: 1.00print("TESTING DATA")
print(f"Mean absolute error: {mean_absolute_error(y_test, y_pred_test):.2f}")
print(f"Mean absolute percentage error: {mean_absolute_percentage_error(y_test, y_pred_test):.2%}" )
print("Root Mean squared error: %.2f" % root_mean_squared_error(y_test, y_pred_test))
# The coefficient of determination: 1 is perfect prediction
print("Coefficient of determination: %.2f" % r2_score(y_test, y_pred_test))TRAINING DATA
Mean absolute error: 0.50
Mean absolute percentage error: 12.94%
Root Mean squared error: 0.93
Coefficient of determination: 0.84def plot_residuals(actual, predicted):
residuals = actual - predicted
plt.figure(figsize=(10, 5))
plt.hist(residuals, bins=20)
plt.axvline(x = 0, color = 'r')
plt.xlabel('Residual')
plt.ylabel('Frequency')
plt.title('Distribution of Residuals')
plt.show()
plot_residuals(y_test, y_pred_test)
Note that here the alpha parameter has been set to 0.05 - this means that the points will be transparent. Higher numbers of points in a given space will appear more opaque.
def plot_actual_vs_predicted(actual, predicted):
fig, ax = plt.subplots(figsize=(6, 6))
ax.scatter(actual, predicted, color="black", alpha=0.05)
ax.axline((1, 1), slope=1)
plt.xlabel('True Values')
plt.ylabel('Predicted Values')
plt.title('True vs Predicted Values')
plt.show()
plot_actual_vs_predicted(y_test, y_pred_test)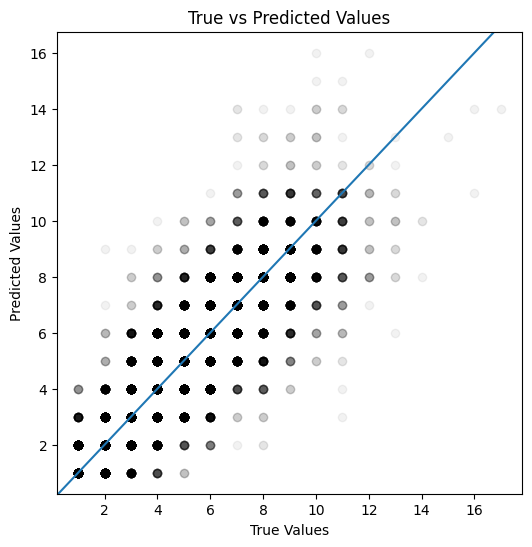
Train a boosting model to predict length of stay based on the variables in this dataset.
X = los_df.drop(columns='lengthofstay')
y = los_df['lengthofstay']
X_train, X_test, y_train, y_test = train_test_split(
X, y,
test_size = 0.25,
random_state=42
)
regr_xgb = XGBRegressor(random_state=42)
# Train the model using the training sets
regr_xgb.fit(X_train, y_train)
# Make predictions using the testing set
y_pred_train = regr_xgb.predict(X_train)
y_pred_test = regr_xgb.predict(X_test)y_pred_testarray([3.6313417, 0.8304186, 2.4800673, ..., 5.5354204, 1.5881324,
5.249632 ], dtype=float32)Assess the performance of this model and compare it with your decision tree model.
print("TRAINING DATA")
print(f"Mean absolute error: {mean_absolute_error(y_train, y_pred_train):.2f}")
print(f"Mean absolute percentage error: {mean_absolute_percentage_error(y_train, y_pred_train):.2%}" )
print("Root Mean squared error: %.2f" % root_mean_squared_error(y_train, y_pred_train))
# The coefficient of determination: 1 is perfect prediction
print("Coefficient of determination: %.2f" % r2_score(y_train, y_pred_train))TRAINING DATA
Mean absolute error: 0.29
Mean absolute percentage error: 10.66%
Root Mean squared error: 0.37
Coefficient of determination: 0.98print("TESTING DATA")
print(f"Mean absolute error: {mean_absolute_error(y_test, y_pred_test):.2f}")
print(f"Mean absolute percentage error: {mean_absolute_percentage_error(y_test, y_pred_test):.2%}" )
print("Root Mean squared error: %.2f" % root_mean_squared_error(y_test, y_pred_test))
# The coefficient of determination: 1 is perfect prediction
print("Coefficient of determination: %.2f" % r2_score(y_test, y_pred_test))TESTING DATA
Mean absolute error: 0.33
Mean absolute percentage error: 11.60%
Root Mean squared error: 0.44
Coefficient of determination: 0.96plot_residuals(y_test, y_pred_test)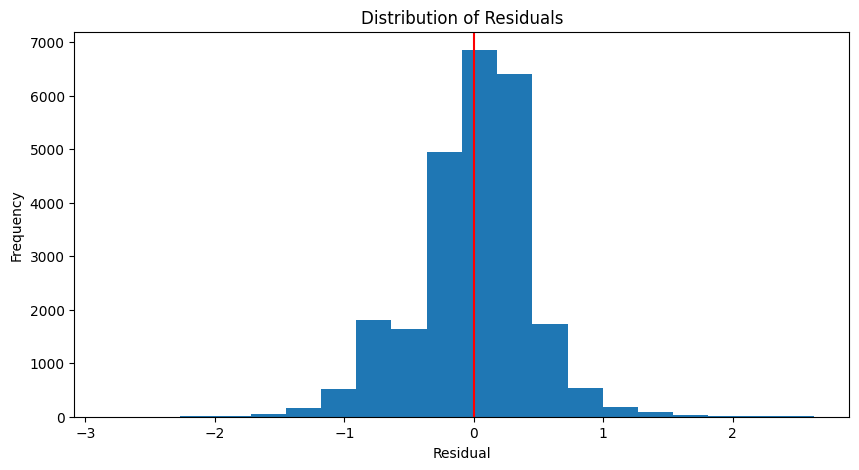
plot_actual_vs_predicted(y_test, y_pred_test)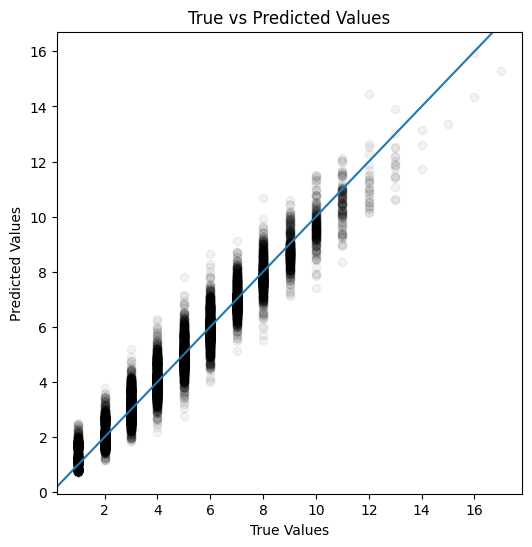
10.2 Extension
Continue to refine your model.
You could - tune hyperparameters - try additional model types (e.g. different boosting trees, linear regression) - try dropping some features - calculate additional metrics - add some visualisations of the features in the dataset - store the results from your different model iterations and display this as a table of metrics - turn this table of metrics into a graph - try using k-fold cross validation
# NO SOLUTION GIVEN11 Challenge
Explore additional aspects of regression modelling using Google, sklearn and other library documentation, Stack Overflow, AI tools, or other avenues.
Some suggestions to get you started: - Look up the assumptions of linear regression. Would our dataset violate any of these assumptions? - What about multiple linear regression? - Investigate the performance of your model on different subsets of the data. Are the errors lower for male and female patients? How about across the different facilities?
# NO SOLUTION GIVEN